
These Are The Best Indicators To Use For Cryptocurrency Trading
We’ve got a list of the best indicators to use for cryptocurrency if you’re looking to sharpen your skills and get started with technical analysis. But before we get into the actual indicators themselves, let’s go over a few of the basics here. Please note that some of the links below may be affiliate links and we might earn a small commission if you make a purchase through them.
What are technical indicators?
Technical indicators are mathematical calculations based on market data, such as price or volume. They are used to predict future market behavior and help traders make decisions about when to buy or sell cryptocurrencies. There are many different technical indicators, and each one can be used in different ways. Some common technical indicators used in cryptocurrency trading include moving averages, Bollinger Bands, and Relative Strength Index (RSI).
What are the benefits of using technical indicators?
Technical indicators are used to attempt to predict future price changes or market trends and as such are divided into two categories: leading and lagging.
Leading indicators give signals about future price changes, while lagging indicators confirm price changes.
Technical indicators can be used alone or in conjunction with other technical indicators or fundamental analysis to provide a more complete picture of the market.
 How do technical indicators work?
Technical indicators are mathematical calculations that use historic price data to predict future price movement. So even though there is no guarantee that past patterns will repeat themselves, oftentimes the same patterns to – at some point at least – repeat themselves.
What are the drawbacks of using technical indicators?
The main drawbacks of using technical indicators are:
- They are lagging indicators, which means they only provide information after a price move has already occurred.
- They are based on past data, which may not be representative of future price movements.
- They can be subject to interpretation, which can lead to conflicting signals.
- They can produce false signals, especially in volatile markets.
How to choose the right technical indicator for your trading strategy?
So – as with nearly any investing or trading related question – the answer depends on the set of circumstances you’re trying trade in and the result you’re trying to achieve.
Along those lines, the best technical indicators for cryptocurrency trading are those that help you understand the market and make informed decisions about when to buy and sell. There are many different indicators available, and it is important to choose the ones that best fit your trading strategy.
How to avoid making mistakes when using technical indicators?
Technical indicators are a valuable tool for cryptocurrency traders, but they need to be used correctly in order to be effective. Here are a few tips on how to avoid making mistakes when using technical indicators:
- Don’t rely on a single indicator. Use a combination of indicators to get a more accurate picture of the market.
- Don’t use indicators as a trading strategy on their own. Indicators should be used as a supplement to your overall trading strategy.
- Backtest your indicator-based trading strategy before implementing it in the live market.
- Don’t forget to monitor the market conditions that indicators are based on. Indicators are only as good as the market conditions they are based on.
- Don’t get too caught up in the details of the indicators. Sometimes it’s more important to focus on the overall picture of the market.
 What are some common mistakes traders make when using technical indicators?
When using technical indicators, some common mistakes include:
- Not accounting for multiple time frames
- Over-optimizing indicator settings
- Failing to backtest
- Ignoring divergences
- Taking trades without confirmation
By avoiding these mistakes, traders can increase their chances of success when using technical indicators.
What are some other resources for learning about technical indicators?
There are a number of other resources that can be helpful for learning about technical indicators, including:
- The website Investopedia has a comprehensive list of technical indicators, with explanations of what each one measures and how it can be used.
- The book “Technical Analysis of the Financial Markets” by John J. Murphy is a classic text that covers a wide range of indicators in detail.
For a more in-depth look at specific indicators, there are a number of training resources available online from sources like TheMinisterofCapitalism.com or see our Educational Products section here.
What are the best technical indicators for cryptocurrency trading?
The best technical indicators for cryptocurrency trading are:
- Relative Strength Index (RSI)
- Moving Average Convergence Divergence (MACD)
- Bollinger Bands
- Stochastic Oscillator
- Average Directional Index
- Parabolic Stop and Reverse
- On-Balance Volume
- Ichimoku Cloud
- Fibonacci Retracement
Let’s look at each one of these individually.
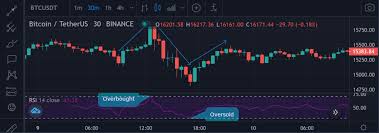
Relative Strength Index (RSI)
How to Use the RSI Indicator
The Relative Strength Index (RSI) is a technical indicator that measures the strength of a security’s recent price performance. It is a momentum oscillator, which means it oscillates between two extremes – 0 and 100. Readings above 70 are considered overbought, and readings below 30 are considered oversold. The RSI can be used to identify potential trend reversals, as well as overbought and oversold conditions.
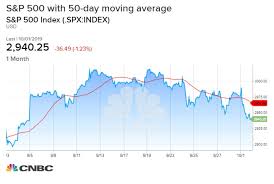
Moving Averages (MA)
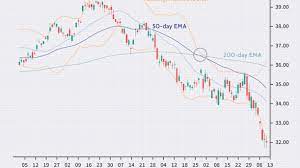
How to Use MA Indicators in Technical Analysis
There are different ways to use moving averages (MA) in technical analysis. The most common way is to use them as a trend indicator. MAs smooth out price action and make it easier to identify the direction of the trend.
Another way to use MAs is to identify support and resistance levels. MAs can act as support or resistance levels, depending on the direction of the trend. For example, if the trend is up, then the MA will act as a support level. If the trend is down, then the MA will act as a resistance level.
Finally, MAs can be used to generate buy and sell signals. A buy signal is generated when the MA crosses above a certain level, and a sell signal is generated when the MA crosses below a certain level.
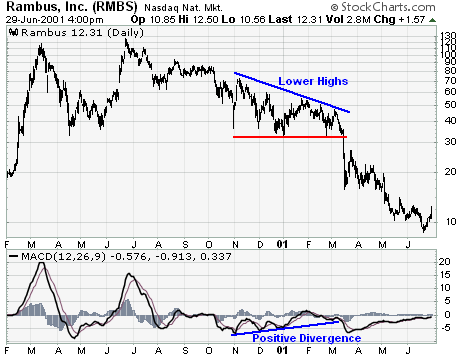
Moving Average Convergence / Divergence (MACD)
How to Use the MACD Indicator
The MACD indicator is a popular tool among traders and investors for analyzing the momentum and trend of a security. The MACD is calculated by subtracting the 26-day exponential moving average (EMA) from the 12-day EMA. A nine-day EMA of the MACD, called the “signal line”, is then plotted on top of the MACD line, which can function as a trigger for buy and sell signals. MACD signals are generated by looking for divergences and crossovers. A bearish divergence occurs when the MACD line diverges from the security’s price action, while a bullish divergence occurs when the MACD line diverges from the security’s price action. A bullish crossover occurs when the MACD line crosses above the signal line, while a bearish crossover occurs when the MACD line crosses below the signal line.
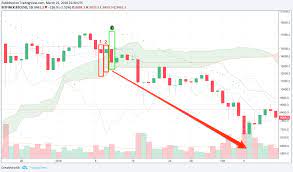
Bollinger Bands
How to Use Bollinger Bands
Bollinger Bands are a technical analysis tool that consists of a moving average ( typically 20-day moving average) and two standard deviations. The standard deviations are plotted above and below the moving average. The Bollinger Bands are used to measure market volatility. When the market is volatile, the Bollinger Bands expand, and when the market is not volatile, the Bollinger Bands contract.
Stochastic Oscillator
How to Use the Stochastic Oscillator
The stochastic oscillator is a technical indicator that is used to measure the momentum of a security. It is based on the premise that price action tends to follow the direction of the overall momentum. The oscillator is calculated using a security’s closing price and its price range over a set period of time.
There are two main settings that you need to be aware of: the %K and the %D. The %K is the most important of the two and it is a measure of the current momentum. The %D is a smoothed version of the %K and it is used to generate buy and sell signals.
The stochastic oscillator can be used in a number of different ways. One common use is to look for divergences between the price and the oscillator. A bullish divergence occurs when the price makes a lower low but the oscillator makes a higher low. This is an indication that the momentum is starting to shift in favor of the bulls.
Another way to use the stochastic oscillator is to look for overbought and oversold levels. The oscillator ranges from 0 to 100. Readings above 80 are considered overbought and readings below 20 are considered oversold. These levels can be used to generate buy and sell signals.
There are a few key things you need to know in order to use the stochastic oscillator effectively. First, you need to know what the oscillator is and how it works. Second, you need to be familiar with the different settings that are available. Finally, you need to understand how to interpret the signal that the oscillator gives you.
The stochastic oscillator is a versatile tool that can be used in a number of different ways. By understanding how it works and how to interpret the signals that it gives you, you can use it to your advantage.
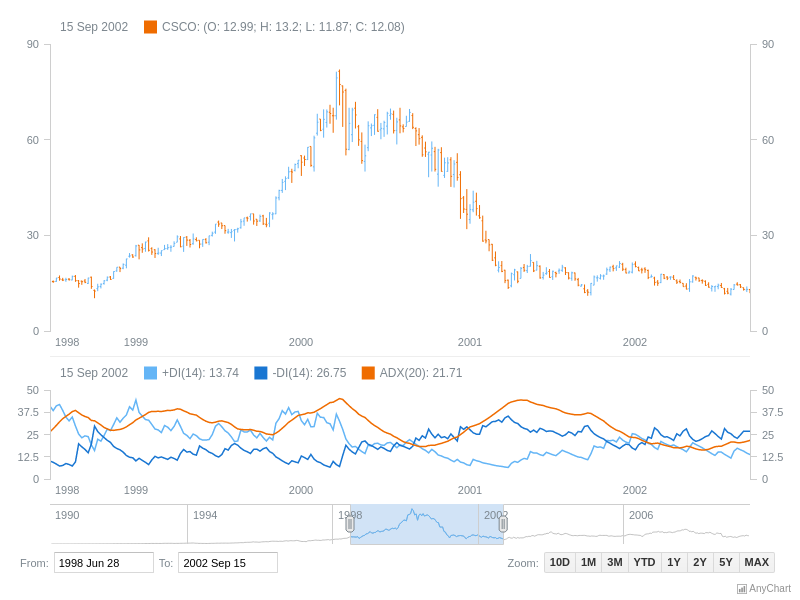
Average Directional Index (ADX)
How to Use the ADX Indicator
The Average Directional Index (ADX) is a technical indicator used to measure the strength of a trend. The ADX is calculated using a combination of three other indicators, which are:
- +Directional Indicator (+DI)
- -Directional Indicator (-DI)
- True Range (TR)
To calculate the ADX, you first need to know the values of the +DI, -DI, and TR. You can then use these values to calculate the ADX.
Parabolic Stop and Reverse (SAR)
How to Use the Parabolic SAR
The Parabolic SAR is a technical indicator that is used to identify potential reversals in price trends. It is calculated by plotting a series of dots above or below the price of a security, depending on the direction of the trend.
The Parabolic SAR can be used to generate buy and sell signals. A buy signal is generated when the dots move from below the price to above the price. A sell signal is generated when the dots move from above the price to below the price.
The indicator is most effective in trending markets. In a strong uptrend, the indicator will generate a series of buy signals. In a strong downtrend, the indicator will generate a series of sell signals.
The indicator can also be used to set stop-loss levels. A stop-loss level can be set below the most recent low in an uptrend, or above the most recent high in a downtrend.
On-Balance Volume (OBV)
How to Use the OBV Indicator
On-Balance Volume, or OBV, is a technical indicator that uses volume data to show the connection between price and volume. The OBV indicator is calculated by taking the difference between the volume of buying and selling days and adding it to a running total. When the indicator is positive, it means that buying is outpacing selling, and when it’s negative, it means the opposite.
OBV can be used in a few different ways, but one of the most common is to look for divergences. A divergence occurs when the price is making new highs or lows but the OBV is not. For example, if the price is making new highs but the OBV is making new lows, that’s a bearish divergence that could be indicative of a coming price drop.
OBV can also be used to confirm trends. If the price is trending up and the OBV is also trending up, that’s a confirmation that the trend is strong. And if the price is trending down and the OBV is also trending down, that’s a confirmation that the trend is weak.
Overall, the OBV indicator is a valuable tool that can be used in a number of different ways. So, if you’re not already using it in your trading, it’s worth considering.
Ichimoku Cloud (IC)
How to Use the IC Indicator
The Ichimoku Cloud indicator is a versatile tool that can be used to identify a variety of market conditions. Here are some tips on how to use it:
- Look for bullish or bearish signals when the price is above or below the cloud.
- A bullish signal is generated when the price breaks out above the cloud. A bearish signal is generated when the price breaks out below the cloud.
- The cloud can also be used to identify support and resistance levels.
- The cloud can be used to identify trend reversals. A bullish reversal is indicated when the price breaks out above the cloud after a period of decline. A bearish reversal is indicated when the price breaks out below the cloud after a period of advance.
Fibonacci Retracement
Fibonacci Retracement is a technical analysis tool that uses horizontal lines to identify potential support and resistance levels. The indicator can be used to identify buy and sell opportunities when the stock price is trending.
Fibonacci Retracements are used to identify potential support and resistance levels. The tool is based on the Fibonacci sequence, which is a series of numbers in which each number is the sum of the previous two numbers. The tool uses three points: the high, low, and closing price of a security. The first point is set at 100%, and the remaining two points are calculated by dividing the distance between the first and second points by the distance between the first and third points.
So there you have it – a quick look at some of the top indicators to use when trading cryptocurrency. Learning to trade is a hugely complex topic and it’s not for everyone. Which is why people often sign up for alert services or look into something different like crypto mining instead.
But if you persist, there are a lot of benefits!
People also searched for answers to questions like these when looking for the best indicators to use for cryptocurrency
Which indicator is the most accurate?
There is no one technical indicator that is more accurate than the others. Different indicators will give you different signals, so it's important to use a variety of indicators to get the most accurate picture of the market. Some of the most popular indicators include moving averages, MACD, and RSI.
What are cryptocurrency technical indicators?
Cryptocurrency technical indicators are tools used to help traders analyze the price of a cryptocurrency and make trading decisions. Some common indicators include moving averages, Bollinger bands, and Relative Strength Index (RSI).
What is macd?
The MACD technical indicator is a momentum indicator that uses the difference between two exponential moving averages to indicate whether a security is overbought or oversold.
What is crypto technical analysis?
Crypto technical analysis is the study of past price movements in order to predict future price movements. This can be done by analyzing charts or by using mathematical models.
What is technical analysis?
Technical analysis is a method of forecasting the future price movements of a security or commodity by analyzing past patterns of price movements. Technical analysts believe that prices move in trends and that these trends can be identified and exploited for profit.
How to buy the dip?
There are a few things you can do to buy the dip: 1) Look for strong companies with good fundamentals that may have been oversold in the market. 2) Buy into sectors that have been hit hard by the sell-off. 3) Use dollar-cost averaging to buy into the market over time, instead of all at once. 4) Keep an eye on your portfolio and make adjustments as needed.
What is a trend line in day trading?
A trend line is a graphical representation of the price movement of a security or market over time. The trend line connects the points on a chart where the price has moved up (or down) from one day to the next. The trend line can be used to identify the direction of the price movement and to estimate future prices.
What are exit indicators for a day trader?
Exit indicators are signals that a trader uses to indicate when it is time to sell a security. Common exit indicators include moving averages, trendlines, and candlestick patterns.
What is the best exit indicator?
There is no single best exit indicator, but rather a variety of factors that can indicate when it is time to exit a trade. Some of the most common indicators include price momentum, volume, and technical indicators like moving averages and Relative Strength Index (RSI). It is important to watch all of these indicators together to get a complete picture of the market conditions, and then make a decision based on what is most likely to result in a profitable trade.
What is the most accurate trading indicator?

There is no one-size-fits-all answer to this question, as the most accurate trading indicator will vary depending on the trader's individual preferences and strategies. However, some popular indicators that traders use include moving averages, Bollinger bands, and MACD. Ultimately, it is up to the trader to experiment with different indicators to find the ones that work best for them.